

Jack Gallant has been focusing a lot of recent lab efforts in the analysis of large-scale fMRI recordings. They published an interesting paper in Neuron last month about the representation of categories in cortex.
Methods
Objects can be classified by humans in thousands of different categories. How are those categories represented in cortex? How would you even try to locate where each of potentially thousands of categories are represented? The authors tackled this problem with a brute-force approach:
- get a long (~2 hour) sequence of short clips
- tag every second of the sequence with ~5 categories chosen from a predetermined hierarchical list (WordNet) with ~1500 categories in it
- put 5 people in the scanner and have them watch the 2 hour clips
- regress categories (X, where each column is a binary indicator of belonging to a category in a given second) against voxel activation (Y) and figure out the representation of semantic space: W = X\Y
- lower-dimensionalize the weights through PCA (equivalently, SVD) to make sense of the data: [U,S,V] = svds(W,4)
- visualize
- …
- profit!
They used the same videos as their reconstruction (“mind-reading”) 2011 Current Biology paper, which if I remember correctly were scraped from YouTube. Tagging this data must have taken anywhere between 3 days and 2 weeks by my guesstimate, which must have been super fun for the first author. The category design matrix was encoded in a way such that columns representing higher level categories (animals for instance) were active whenever one of the subcategories was present on screen (e.g. dolphins and octopuses).
As far as the regression goes, it’s pretty standard stuff: L2-regularized regression with 15-fold cross-validation. Here’s an example of the weights for a voxel selective for man-made things:

They used PCA to reduce the dimensionality of the data and to aid in visualization. They found 4 significant principal components – that is, 4 dimensions in category space corresponding to maximum modulation in cortical space. I wonder if more significant PCs/less noisy estimates could be recovered by combining the regression and PCA steps through nuclear-norm penalized regression.
Principal semantic components

So what do these 4 PCs correspond to? Roughly:
- mobile versus immobile
- social vs. nonsocial
- civilization vs. nature
- animal vs. non-animal
What does that mean? The fact that the first PC represents mobile vs. immobile means that there’s a large difference in brain activation if you present a mobile vs. an immobile stimulus. Does that mean that there’s a lot of brain space that is devoted to encoding mobile stimuli? That’s a little fuzzy. Movable things like people and animals tend to move (!). Stuff that moves also tends to command attention. Stuff that demands attention is usually in the foreground. Stuff in the foreground is salient. And of course stimuli that are salient or moving or movable or in the foreground or that command attention will cause a lot of more activation than boring stimuli, especially in visual areas (both in ventral and dorsal visual streams).
Thus, the semantic components represent directions in semantic space which are associated with large modulations in brain space. So category 1 tells us that visual areas are segregated from non-visual areas. Category 2 tells us that some some areas of the brain are selective for social things whereas others aren’t. And so on and so forth. Again, the distinctions between the categories aren’t super clear; animal vs. non-animal could also mean alive vs. dead.
It’s déjà vu all over again
It’s tough to unambiguously pinpoint what a given area is selective for. We’ve seen this problem before – there was a controversy for a long time over the exact category encoded by the fusiform face area, whether it’s faces or it’s a general expertise area. The method used in the paper is a big improvement over fMRI protocols relying on contrast between a handful of categories. The problem with a statement like “area A is selective to stimuli of category B” is that there’s a bunch of other categories which aren’t tested and might activate area A more. What you should really say is “area A has the largest activation of all tested area to stimuli of category B”. Admittedly that’s a little less snappy. The paper avoids a big part of this issue by using the machine gun approach: try every category in the book.
With the approach that they used, they obtained, in effect, functional maps for ~1500 categories. This is a very useful dataset. James Gao and Alex Huth recognized how useful this could be and pushed to have the data published online. Not just dumped, but presented in an interactive WebGL visualization that is awesome both from technical (WebGL!) and scientific (so much data!) perspectives. You can make your own visualizations of this kind with their open-source Python toolkit.
Here’s the activation map for the “text” category:
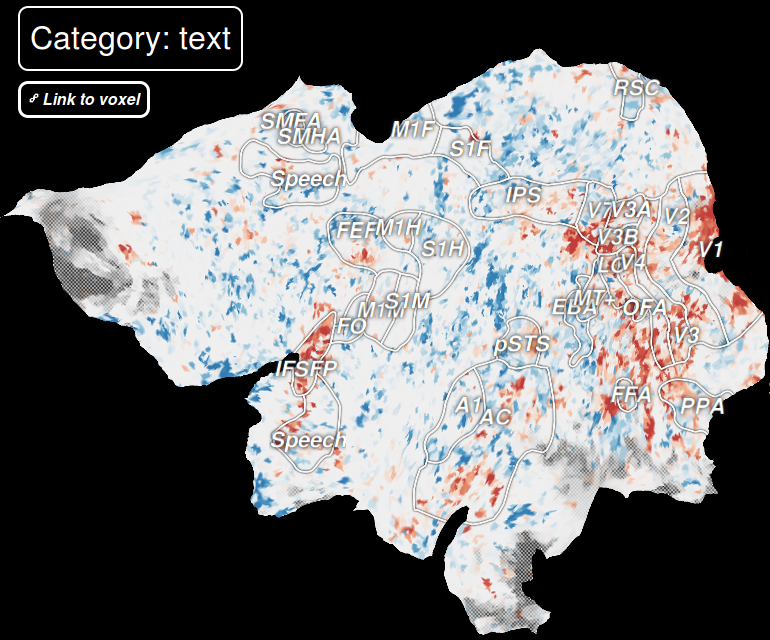
We have some expected stuff here: activation in early visual areas, IT, high level auditory cortex and multisensory areas. But we also see unexpected stuff, like activation in the inferior frontal sulcus face patch, which as far as I could tell is an area that is only mentioned in a couple of papers; who knows what the heck it does? I could see somebody repeating the basic protocol with more subjects and basically do every “area X responds to Y-type stimuli” study, once and for all.
Semantic gradients?
One of the main claims of the paper is that the recovered semantic components are organized into smooth gradients that cover both visual and nonvisual cortex. When I first read this, I thought: what does that even mean?
One of the ways you could interpret this is to think about maps. Maps are a main organizational principle of cortex. V1 has multiple overlapping maps: orthogonal maps for angle and (log) eccentricity, pinwheel maps for orientation, etc. You could imagine that a big area like IT also has maps, and these are maps of semantic content. You could have non-biological things (toasters) on the left, biological things (faces) on the right, tools (hammers) on top and non-tools (mountains) at the bottom, for instance. That would be very neat.
A contrasting concept is that of a hierarchy. As you go from V1 to V2 to V4 to IT, you get both selectivity for more complex things and invariance to irrelevant parameters like position. So if you look at a parameter like selectivity for curvature, there’s an increase as you go from V1 to IT. But it wouldn’t (I think) qualify as a gradient or map for curvature; each area is discrete, as evidenced by retinotopy, and within each the representation of curvature is more or less homogeneous.
Plotting the PCs in a color code on the cortical surface reveals a kaleidoscopic representation of semantic categories. It’s beautiful stuff.
One argument that they make is that the semantic maps are much smoother than expected by chance. That certainly reinforces the idea that the representation is “real”. For instance, auditory cortex is fairly homogeneous in its blue-green color, which is associated with text, communication, and talking. But that, in itself, is not an argument for semantic gradients. The issue is that you could have a scenario where within each area a category is represented, and surrounding areas represent unrelated categories; that representation would still be smooth in terms of correlation across voxels, because each area spans multiple voxels, but it wouldn’t be a semantic map per say. The fact that component 1, which seems to distinguish between visual and non-visual areas, also means that the semantic represent will necessarily be smooth, but for trivial reasons.
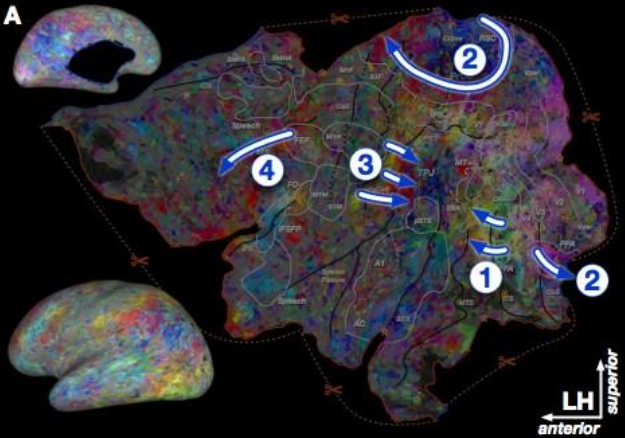
You have to dig deeper in order to find the semantic maps. They point out, for instance, that there’s a gradient from animal to people representation in IT (arrow 1); the fusiform face area is located within the people patch. This could qualify as a semantic map. Probably the most convincing gradient visually is in the precuneus (PrCu, arrow 2); unfortunately, AFAIK the precuneus is very poorly understood so it’s impossible to see whether the gradient corresponds to known anatomy/electrophysiology.
Thus, I wouldn’t say that the claim that there are genuine semantic gradients is very solidly argued. I’m sympathetic to the idea, but I’m guessing it’ll take more data/fancier processing to see a clear(er) picture emerge.
In any case, cool paper, especially given that you can play with the data online and make your own judgements about it.
![]()
Huth, A., Nishimoto, S., Vu, A., & Gallant, J. (2012). A Continuous Semantic Space Describes the Representation of Thousands of Object and Action Categories across the Human Brain Neuron, 76 (6), 1210-1224 DOI: 10.1016/j.neuron.2012.10.014
