
I ran into a tricky problem while analyzing a series of experiments we recently performed with Scanbox. We’re trying to estimate the angle of the objective with respect to the cortical surface.

The way we approach this is by scanning at a given depth, going down a little bit, scanning again, and so on. By measuring the displacement of the mean images from slice to slice we can get an estimate of the angle of the objective with respect to the cortical surface.

It’s important to get a good estimate of the depth of a recorded ROI to understand how computations are elaborated by different layers of neurons. The depth varies within an imaging field as a function of the angle of the objective with respect to the cortical surface, so we need a good estimate of that angle.
We estimated the xz angle in some 9 different experiments by measuring the displacement of the imaging field in consecutive fields. Here they are with error bars:

It’s pretty clear here that the data cluster at around -15 degrees, but it’s noisy. Some of the variation is due to legitimate differences between samples – we aim to perform similar surgeries and injections every time, but it’s biology, so there’s always going to be some variation – and some of it is due to measurement noise.
The very noisy observations are due to the sample moving, i.e. during grooming. It’s easy enough to say “well you should have gotten the data right the first time”, and of course that’s what we always aim for, but we’re not going to scrap days worth of data because we got unlucky for a few minutes. Rather, to get an optimal per-experiment estimate of the angle, we’d like to shrink the noisier observations towards the weighted population mean.
This is a perfect fit for a Bayesian hierarchical mixed effects model. There’s a fixed effect (the mean angle across experiments), and there’s a random effect (the per-experiment angle):
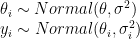
We’d like to compute some weighted mean of these two effects to come up with an optimal estimate of the angle per experiment, i.e. get estimates of 
This maps exactly onto the per-school mean SAT example from Gelman et al., chapter 5, a two-level hierarchical model for Normal-distributed means. I had written up about getting this model going in R about 4 years ago. I fired up the model in RStudio – the standard IDE for R these days, rather than RKward – and it works as is. Here’s what the shrunken estimates look like:

Much better. The final per-experiment estimates vary between -17 and -12 degrees, which is pretty reasonable considering the biology. With this, we have a principled estimate of the objective angle that optimally pools mean experiment and per-experiment effects.

One response to “Bayesian mixed effects model to estimate experimental parameters”
[…] Bayesian mixed effects model to estimate experimental parameters […]